Negotiations took place between the US and Iran in June. These resulted in the announcement of a temporary agreement (Memorandum of Understanding) providing for a 60-day ceasefire and the reopening of the Strait of Hormuz to tankers. Both sides have portrayed this as a step towards genuine peace. But can we really believe that?
The latest statement by US Vice-President J. D. Vance casts doubt on this. In an interview with Michael Knowles, Vance explicitly admitted that this was in fact a tactical pause and not a permanent agreement. He explained that the main objective was to restore global oil reserves, and that what happens next remains an open question. War could break out again, or there could be lasting peace. The latter, however, depends on a “major shift in Iran’s approach”.
Apart from Vance, it is safe to assume that Tehran will not back down from its demands, and therefore an escalation is highly likely. However, there is one factor that could really weaken Iran’s position: oil. Iran is having serious problems selling it. Following the announcement of the MOU and the lifting of some of the sanctions, Tehran has attempted to export oil on a massive scale, but so far without success. According to Stephen Innes, between late June and early July, more than 58 million barrels of Iranian oil were at sea, of which more than 90 per cent had no clear destination, as shown in the chart below.
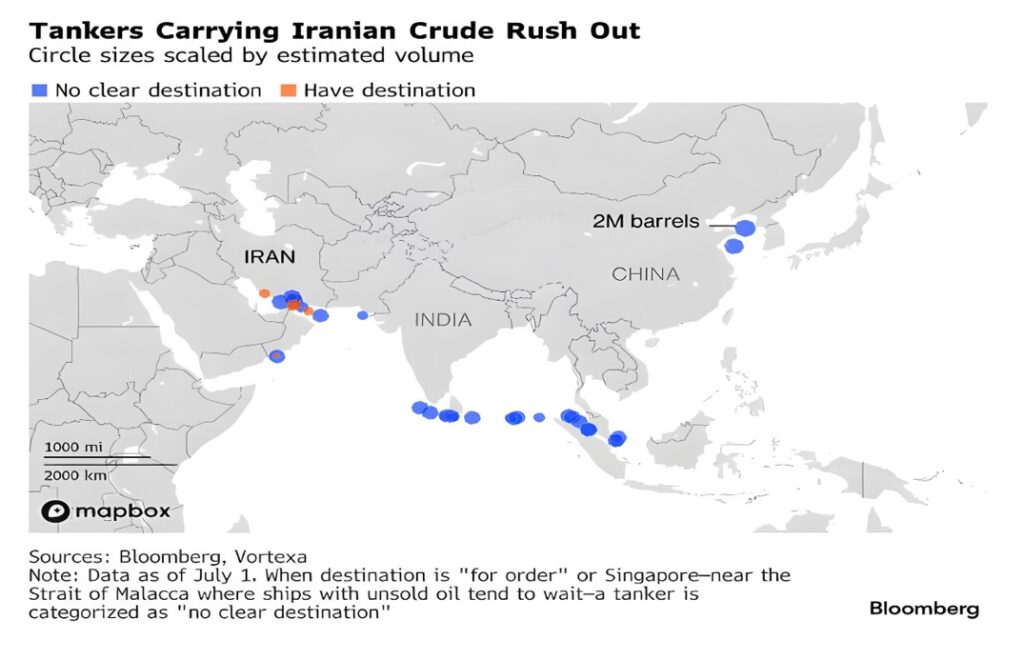
Fully loaded tankers are anchored near the Strait of Malacca and the Chinese coast. Iranian oil is flowing there in huge quantities (more than 2 million barrels), but Chinese refineries are unwilling to buy it. The reason is the sharp fall in domestic demand in China, which is leaving Chinese refineries with insufficient margins. In any case, Iran only has until the end of August before the period set out in the MOU expires. The longer the problems with oil sales persist, the greater the pressure on Tehran’s public finances, as the anchored tankers merely incur additional costs. This, in turn, could lead to Tehran making major concessions to the US when the time comes for further negotiations.
At the same time, we must not forget Israel, which will do everything in its power to torpedo the peace negotiations. The current agreement should therefore be viewed primarily as a strategic pause before the cards are reshuffled in the Middle East conflict.